
Adding trends, averages, and phase change lines to your graph.
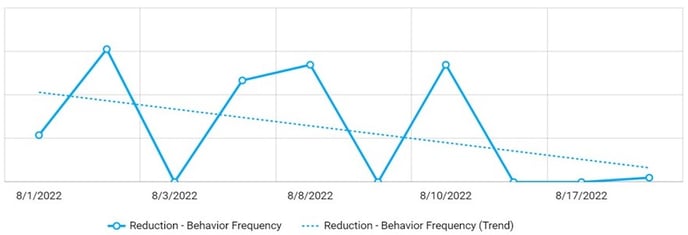
For effective analysis of your data, trends, averages, and phase change lines are a practical way to visually indicate a change in condition or phase on a graph.
Trends & Averages
To add a trend and/or an average line to your graphs you will select a client, go to Progress on the left side menu and choose the graph that you would like to edit.
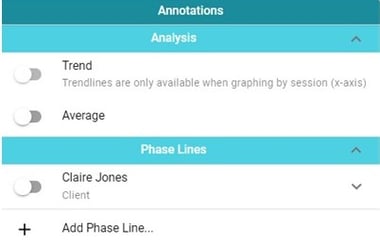
Once on the selected graph, click on the ![]() icon and select Annotations > Analysis. You will then select the toggle for Trend and/or Average.
icon and select Annotations > Analysis. You will then select the toggle for Trend and/or Average.
Important Note
Trends are currently available only when graphing by session (along the x-axis).
Phase Change Lines
To add a trend and/or an average line to your graphs you will select a client, go to Progress on the left side menu and choose the graph that you would like to edit.
Once on the selected graph, click on the ![]() icon and select Annotations > Phase Lines. You will then click on
icon and select Annotations > Phase Lines. You will then click on ![]() Add Phase Line.
Add Phase Line.
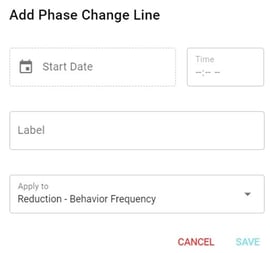
Indicate Start Date, Time, Phase Label, and select if you want to apply it to the current graph or to all graphs for that specific client. Then select Save.
Important Note
To ensure that your annotations, like phase-change lines, trend lines, and averages are present the next time you view the graph, select theicon on the top right of the graph area. Here, you can name the view of your existing settings and save it for quick future reference.
To edit an existing phase change line, select the phase label from the Annotations list, and you can adjust the date, time, or label as necessary.