Things to Keep in Mind with ABC Data:
- Each Learner can only have one ABC Data Collection Program assigned to them.
- ABC Data does not show up in the activity history or session data table.
- ABC Data is time-stamped.
- ABC Data can be taken during a session or outside of a session.
📹 Watch: Setting up an ABC Data Collection Program for a Learner
ABC Program Setup
Before you can gather Antecedent-Behavior-Consequence data during a session, a Behavior Incidents program must be created.
1. Select
 from the left side navigation menu of your client’s page
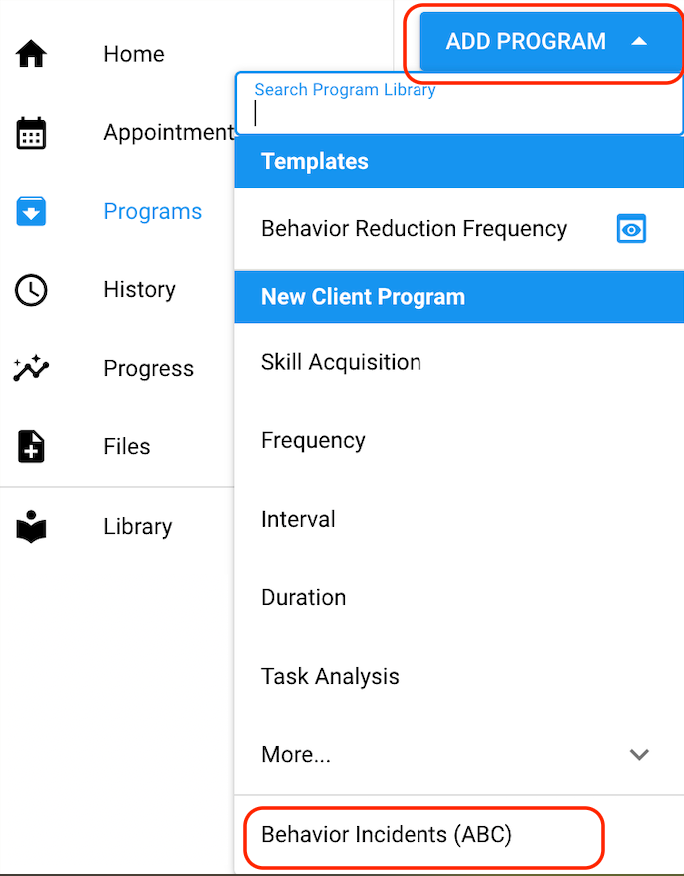
2. Select the blue [ADD PROGRAM} icon.
3. Select [Behavior Incidents (ABC)] from the drop-down menu.
4. Create Groups
- [Targets] tab
- Three preset groups will populate: Antecedents, Behaviors, Consequences.
- Select [ADD GROUP] to create additional groups for data collection. You can choose to rename the Group titles as you wish.
💡TIP: Add "Location" as an additional group to easily document the setting in which ABC episodes take place. Add "User" as an additional group to track the user who is reporting the data.
5. Create Items
- [ADD ITEM] to each of the groups.
-
-
-
- The items added here will appear as selections in a drop down menu for users to select from when collecting ABC Data.
-
-
- Users will also be able to add items to the group by typing in the text box and pressing enter/return on their keyboard.
- This can be helpful if the item is not an existing option in the drop down menu.
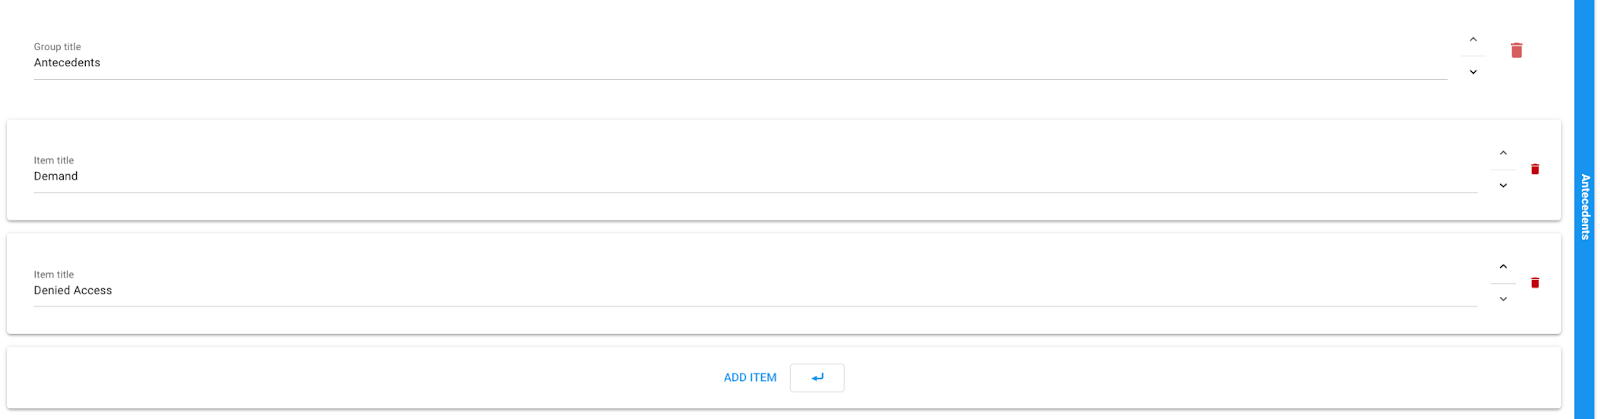
- Below is an example of a completed Group “Antecedents” with Items “Demand” & “Denied Access”.
Repeat Steps 4 & 5 to create additional Groups and add items to each group as outlined above.
Collecting ABC data
You can collect ABC data either during or outside of a session.
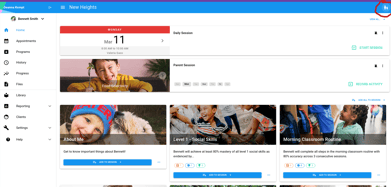
To collect ABC data click on the icon  on the top right side of your screen. Please refer to the screenshot below for a visual:
- Once you have clicked on your ABC icon you will be able to start taking your ABC data:
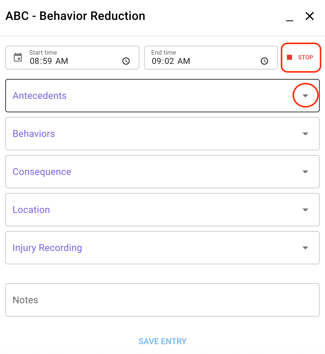
- You can adjust the [Start time] and [End time] of the event by selecting the clock icon, or use the
 and
and  icon to track separate ABC events/ occurrences.
 - To collect ABC data, select the arrow to the right of the group name (e.g., Antecedents) to view the drop down menu and make a selection from the items listed.
- Optional [NOTES] You can add relevant notes about that behavior event.
- Click on [Save Entry] to record the episode and continue with your session.
NOTE: Unlike other programs, the ABC data is not specifically linked to a particular session. As this component is present across all environments, once you've created your ABC program, you do not need to specifically add it to any of your scheduled sessions.
How do I view ABC Data?
Now that ABC data has been collected, you have two options to view it:
Option 1. [History] >> [Timeline]
The Timeline view will allow you to find a specific session in which ABC data was collected.
This view will provide a timestamp, duration of behavior event, and display information related to the antecedents-behaviors-consequences.
If additional groups were created during setup, such as Location, this information will be displayed here as well.
- Select [History] from the left side navigation menu
- Select the [TIMELINE] tab at the top
- Find the session and select the session row with the orange icon

- Clicking the session will pull up the ABC data collected
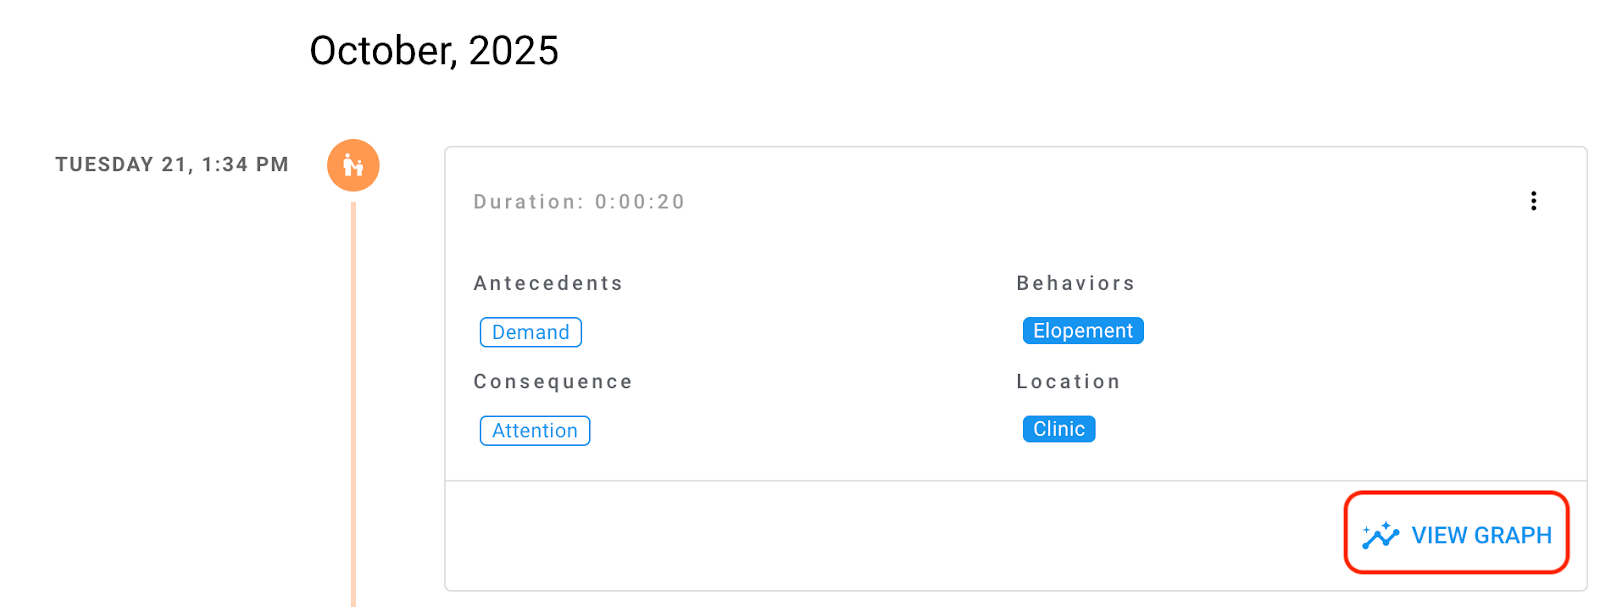
- To view a graph and access additional insights, select the [VIEW GRAPH] icon
- This will redirect you to the the client’s [Progress] page
- Read more about this below in Option 2.
- This will redirect you to the the client’s [Progress] page
Option 2. [Progress] >> [Behavior Incidents (ABC)]
To quickly view all ABC data follow the steps below:
- Select
 from the left side navigation menu of your client’s page
 - Stay on the [OVERVIEW] page
- Scroll down and select
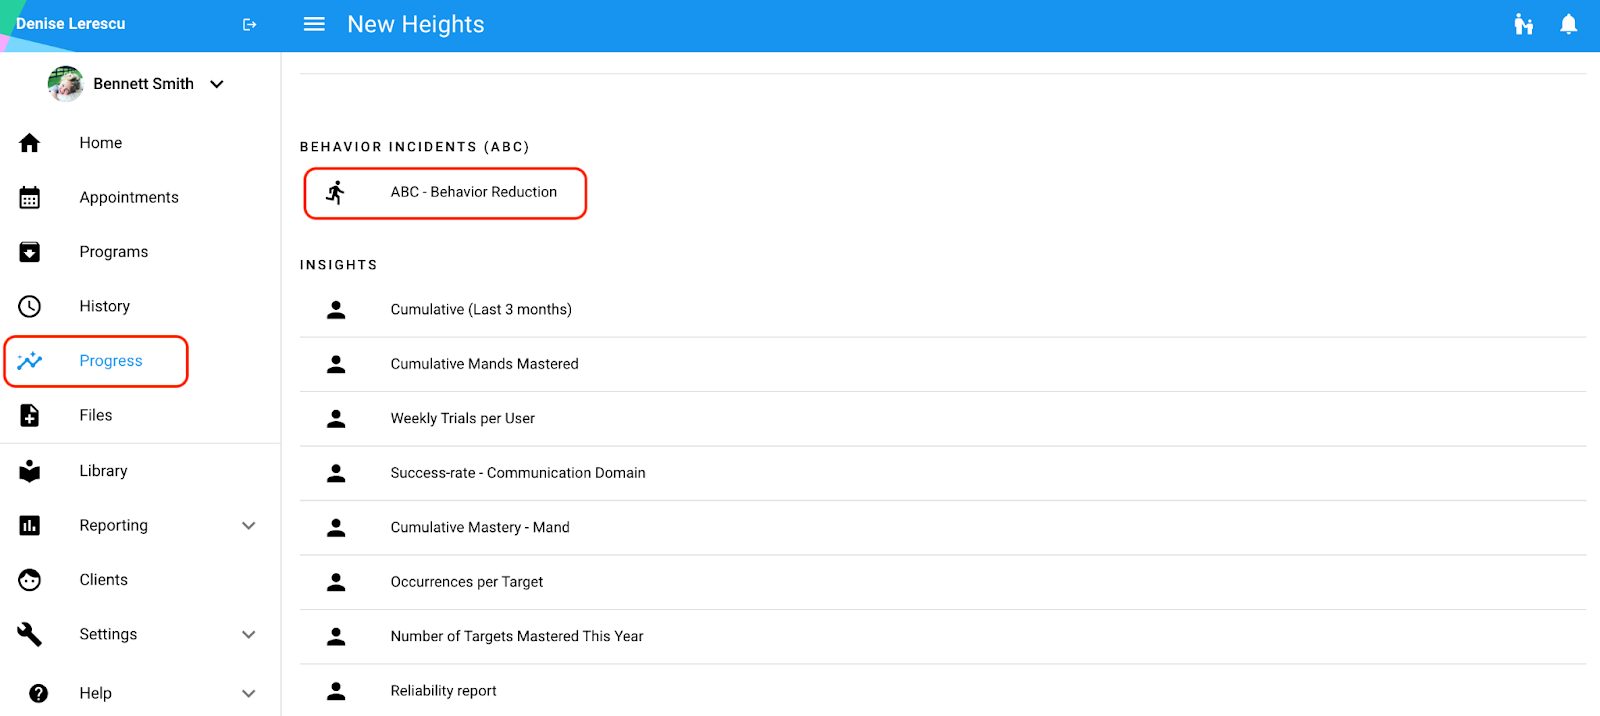
When you have clicked on the ABC data chart under the Behavior Incidents (ABC) section you will see the information on a graph.
To learn more about graph settings for ABC data, CLICK HERE.
📹Watch: How to view the graph for ABC data
-Updated October 2025