📹 Watch: Analyzing Trial by Trial Data in Hi Rasmus
Graph Settings Overview
- Data Period
- Data Source
- X-Axis Settings
- Y-Axis Settings
- Filter Settings
- Group Settings

Viewing Trial by Trial Data on a Progress Graph
The graph settings toolbar allows you to adjust the graph, enabling you to filter and analyze the data you need.
💡 TIP: To view the settings toolbar, select the  icon in the top right corner of the graph. Follow the steps below to learn more about each filter setting.
1. Data Period: Select the time frame you want displayed on the graph.
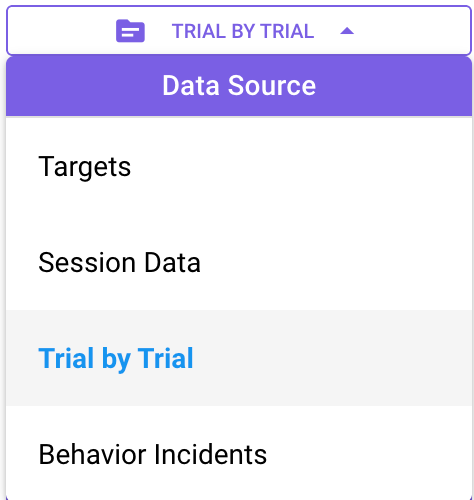
2. Data Source: Beneath the time frame filter, set your data source as [Trial by Trial].
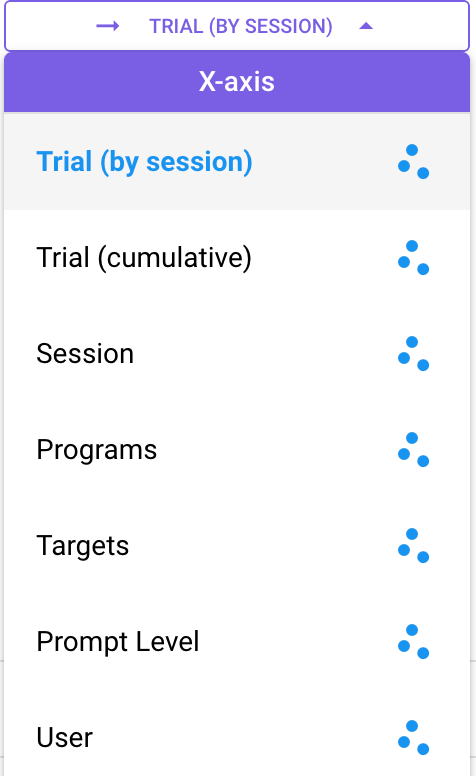
3. X-Axis: Beneath the data source filter, set your X-Axis (horizontal axis) to one of the following options:
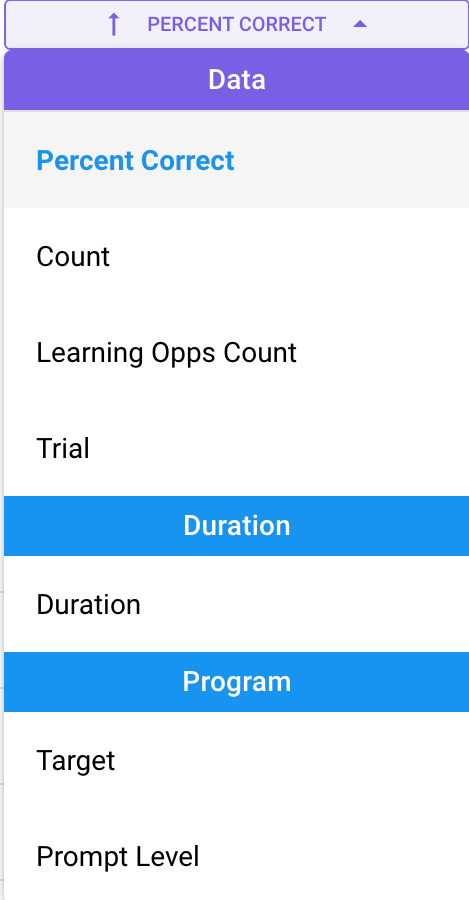
4. Y-Axis: Beneath the X-Axis filter, set your Y-Axis (vertical axis) to one of the following options:
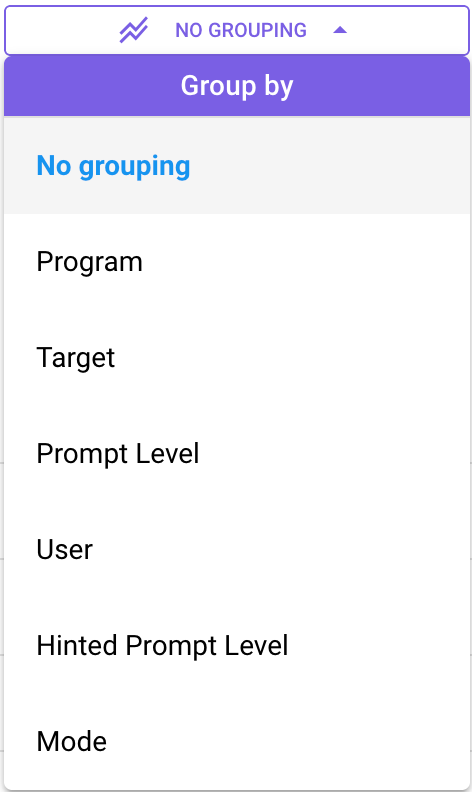
5. Group by: Select how you want to group your data points by choosing one of the following options:
Trial By Trial Graph Examples
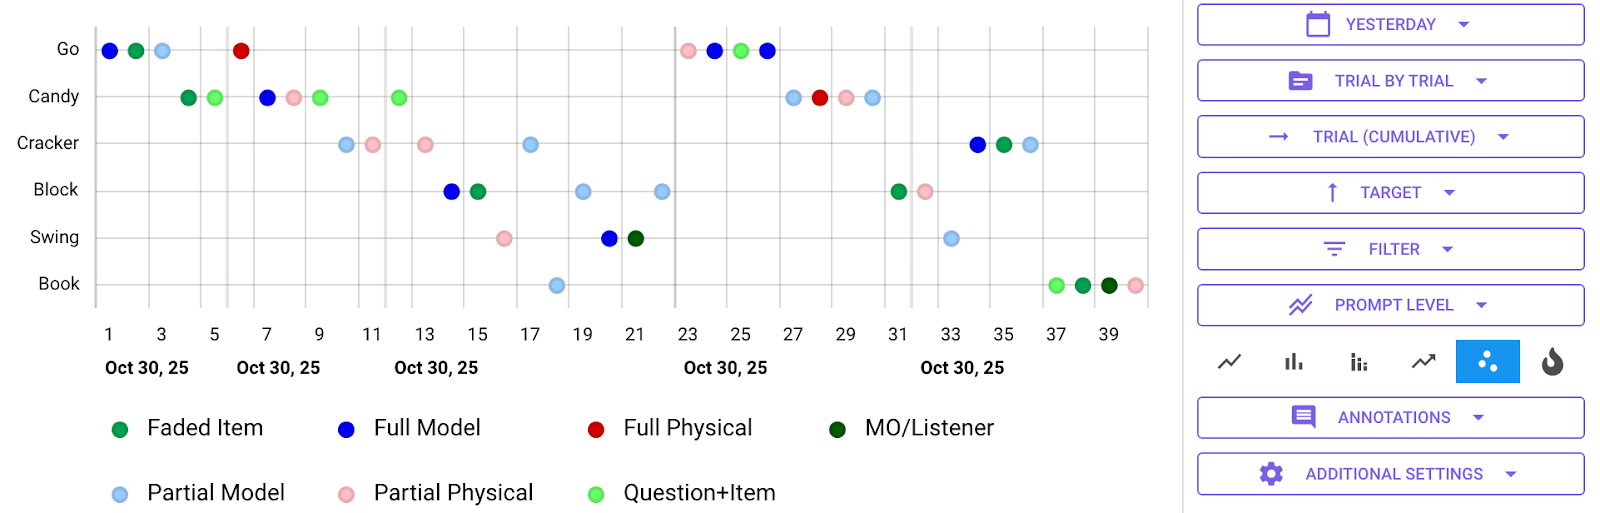
Cumulative trials from yesterday by target, grouped by prompt level
- Data Period: Yesterday
- Data Source: Trial by Trial
- X-Axis: Trial (Cumulative) - this will show the total number of trials for the entire date period of the graph
- Y-Axis: Target - this will show all of the program's targets along the Y-Axis
- Group By: Prompt Level - Each trial will be a color coded dot based on the prompt level that was selected during that trial. The prompt level options will show up along the bottom of the graph and can be selected to remove or add to the graph.
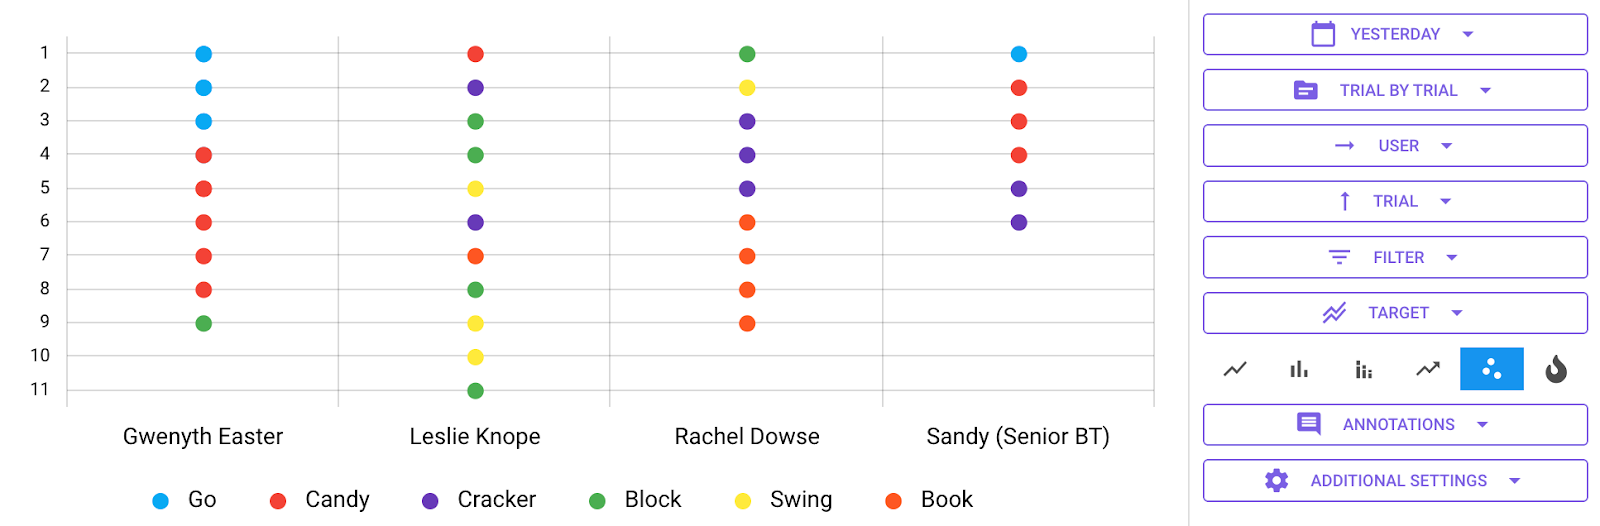
Previous 7 days: total trials per user, grouped by target
- Data Period: Yesterday
- Data Source: Trial by Trial
- X-Axis: User
- Y-Axis: Trial (the trial count)
- Grouped By: Target
Terminology
X-Axis (3rd drop down)
Trial (Cumulative): This will show you the total number of trials along the X-Axis for that data period
Trial (by session): The trial count along the X-Axis will restart if there were multiple sessions within the data period
Group By (6th drop down)
Hinted Prompt Level: Group the data points by the prompt level that was hinted during that trial - this requires you to have automatic prompt fading set up on the prompt level template
Mode: Groups the data points by the specific mode the trial was taken in, used in programs such as Sufficient Exemplar Training and Skills-Based Treatment (SBT).
-Updated November 2025