
Article Navigation
Assessment-Specific Information: ABLLS-R | AFLS | BHI | CFQL-2 | FAST | IGLR | KIDSCREEN | MOTAS | PDDBI | PSI | QABF | VB-MAPP | Vineland-3
How to Add Assessment Results
These steps are the same for every assessment. Check the Assessment Quick Reference below to see which fields your assessment has, then see that assessment's section for its score fields.
1. Select the client's name from the drop down in the top left corner.
2. Click the [Progress] tab on the left hand side.
3. Click the [Assessments] tab in the middle of the page.
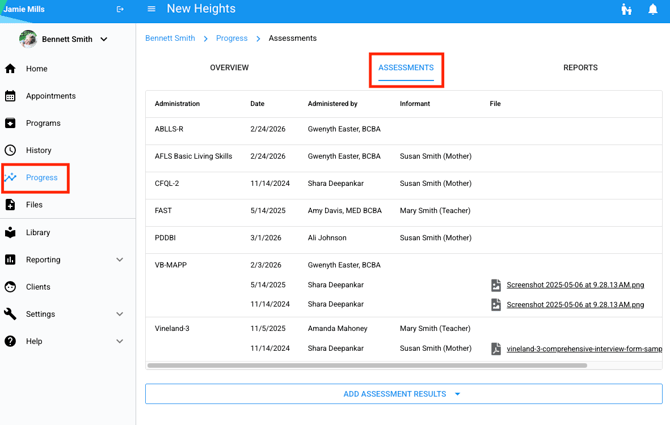
4. Click [Add Assessment Results] at the bottom of the page.
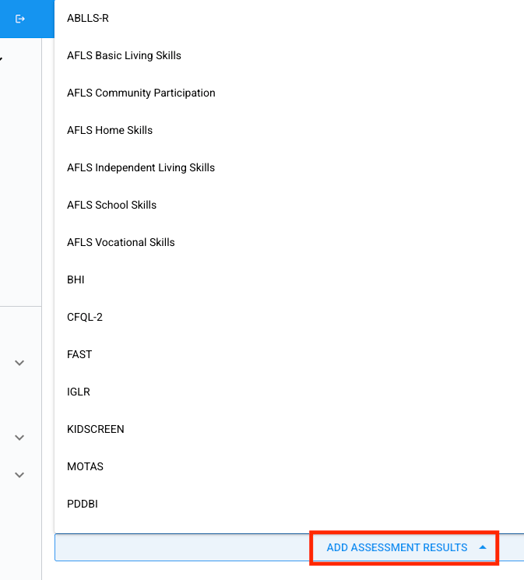
5. Select the assessment from the drop down menu.
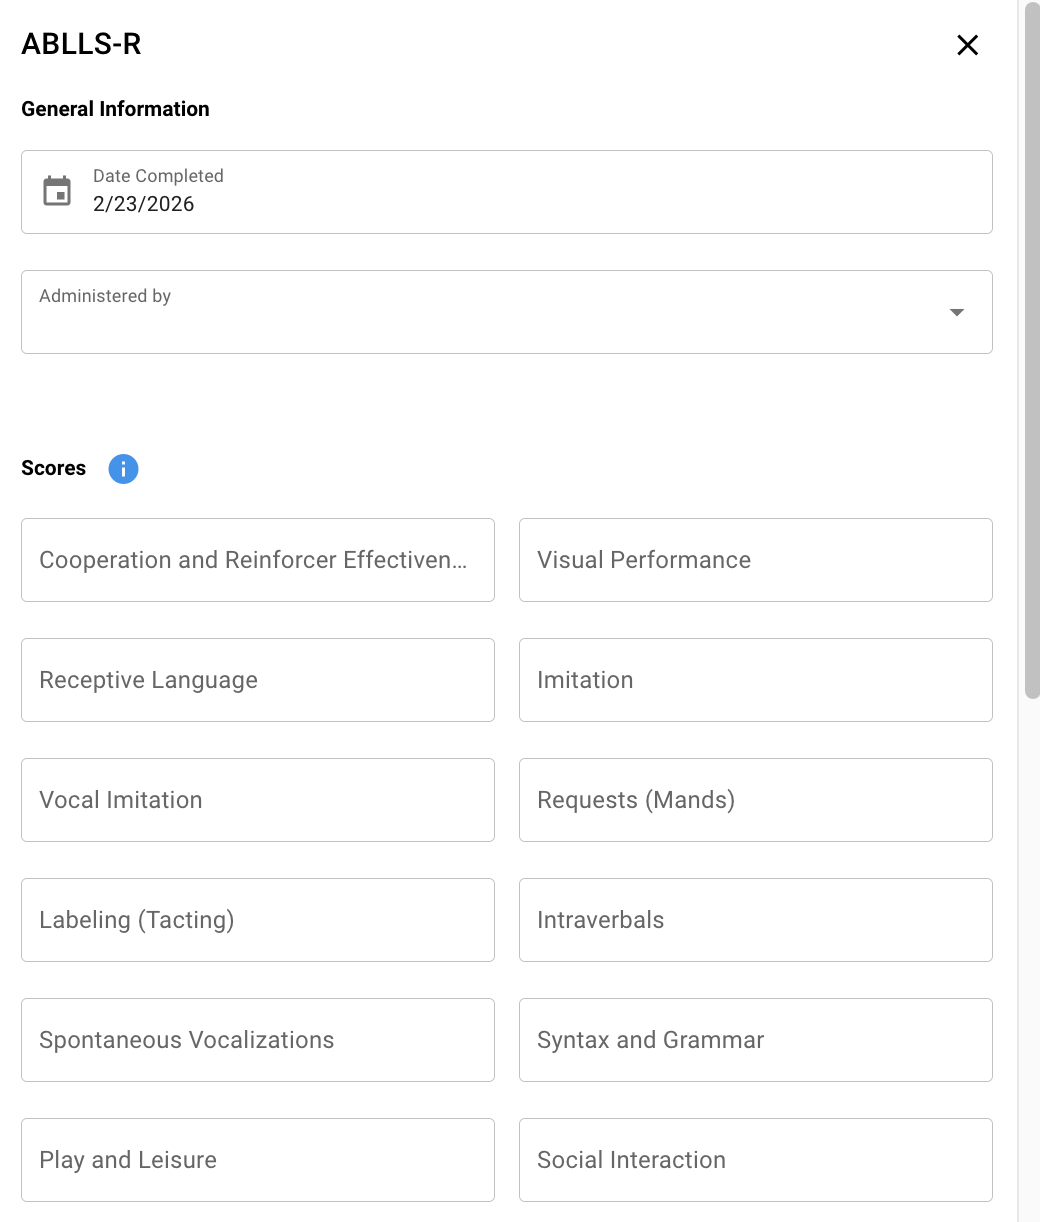
6. Complete the [General Information] section
ℹ️ Note: [Administered by] is the clinician in the system.
The Date will display on the graph. For assessments with an [Informant] field, see that assessment's section below.
7. Add [Behavior Information] (FAST and QABF only)
-
The name of the Behavior is added to the graph.
-
The Description of the Behavior (optional) is for storing purposes only. This will not display on the graph.
-
If the clinician is tracking multiple Behaviors, complete an Assessment Results Entry for each Behavior.
8. Add the [Scores]
-
Score fields are not required. If the clinician did not complete a section, leave that field blank. The clinician is still able to generate a graph with the data points entered.
- The score fields are different for each assessment. See that assessment's section below.
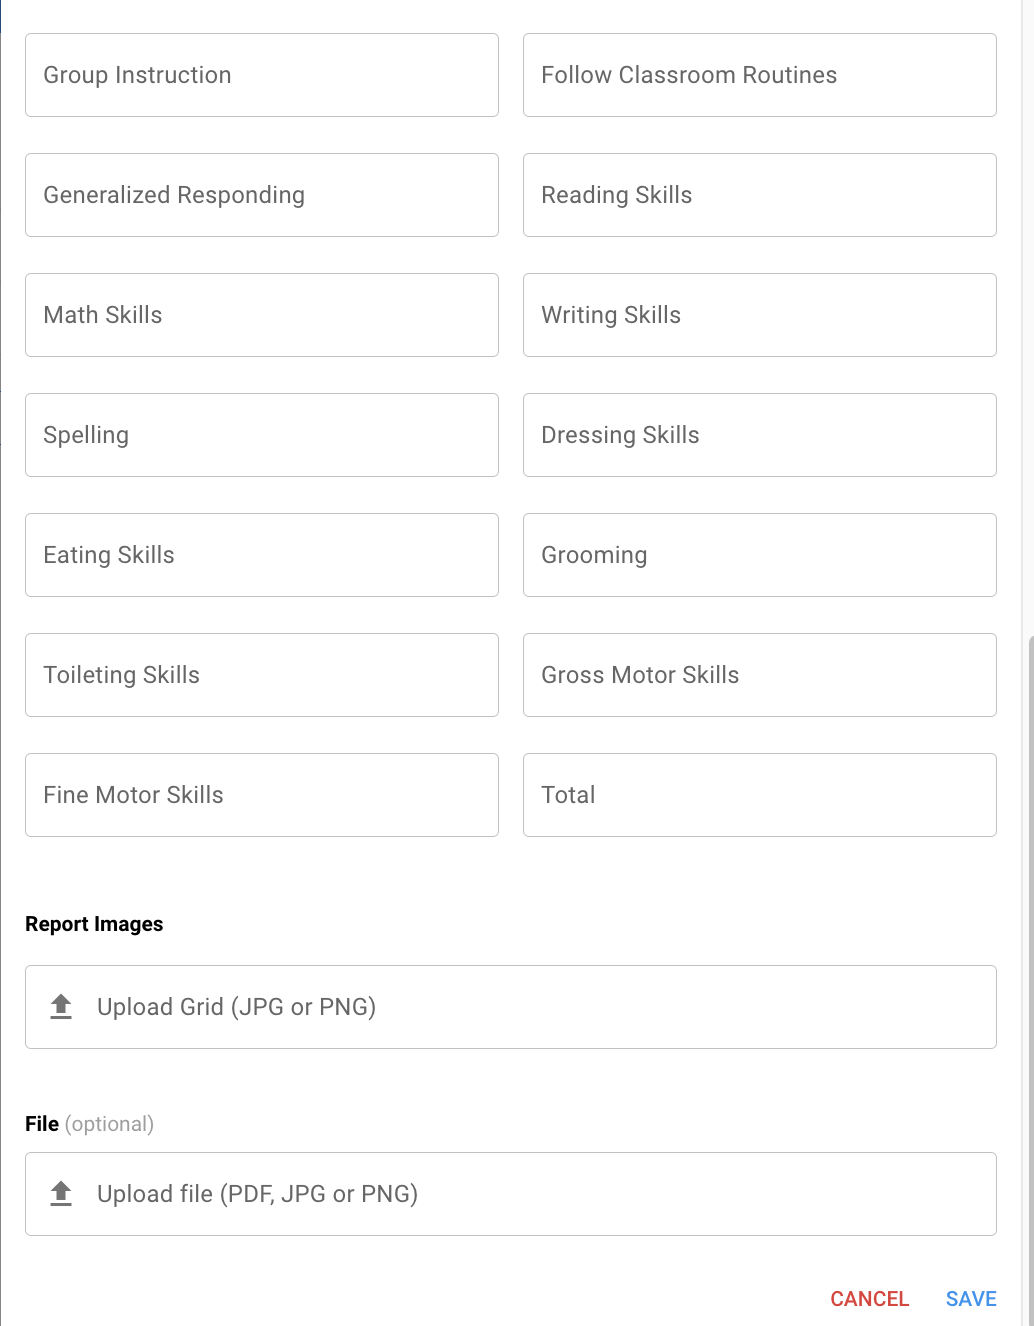
9. Add [Report Images] (if available for the assessment)
-
These images can be displayed on the Learner's Report. For a step-by-step guide on how to add report images to a Report, click HERE
10. Add [File] (Optional)
-
The optional File add is for storage purposes only. This file does not generate on the graph or report.
-
Only one file can be uploaded here. If the clinician has multiple files, combine the files into one PDF, JPG, or PNG and then upload.
-
For any additional file storage, upload the file within the [Files] tab for that client.
11. Select [Save]
12. Review the graph
ℹ️ Note: The information on the assessment entry can always be edited. Select the three dots on the right side of the assessment name. Select [edit] then make the changes
💡 Check out our KB Article on how to Add Assessment Results into Reports
Assessment Quick Reference
|
Assessment |
Informant |
Report Images |
Scores Entered |
Total Score |
|---|---|---|---|---|
|
ABLLS-R |
No |
Yes |
Section Scores |
Max 544 |
|
AFLS |
Yes |
Yes |
AFLS Scores |
Entered manually for each |
|
BHI |
Yes (optional) |
Yes |
Raw Scores |
Out of 60 |
|
CFQL-2 |
Yes |
No |
Raw Scores |
No |
|
FAST |
Yes |
No |
Potential Source of Reinforcement |
No |
|
IGLR |
No |
No |
Percentile Scores (10 fields) |
No |
|
KIDSCREEN |
No |
No |
Sum, Rasch, T-Scores |
No |
|
MOTAS |
Yes (optional) |
Yes |
Raw Scores |
Max of 5945 |
|
PDDBI |
Yes |
No |
T-Scores |
No |
|
PSI |
Yes |
No |
Percentile Scores |
No |
|
QABF |
Yes (optional) |
Yes |
Behavior Function Scores |
No |
|
VB-MAPP |
No |
Yes |
Milestones, Transitions, Barriers |
Totals entered per field |
|
Vineland-3 |
Yes |
Yes |
ABC & Domain Standard Scores |
No |
Assessment-Specific Information
Each section below lists what is unique to that assessment. For the full steps, see How to Add Assessment Results above.
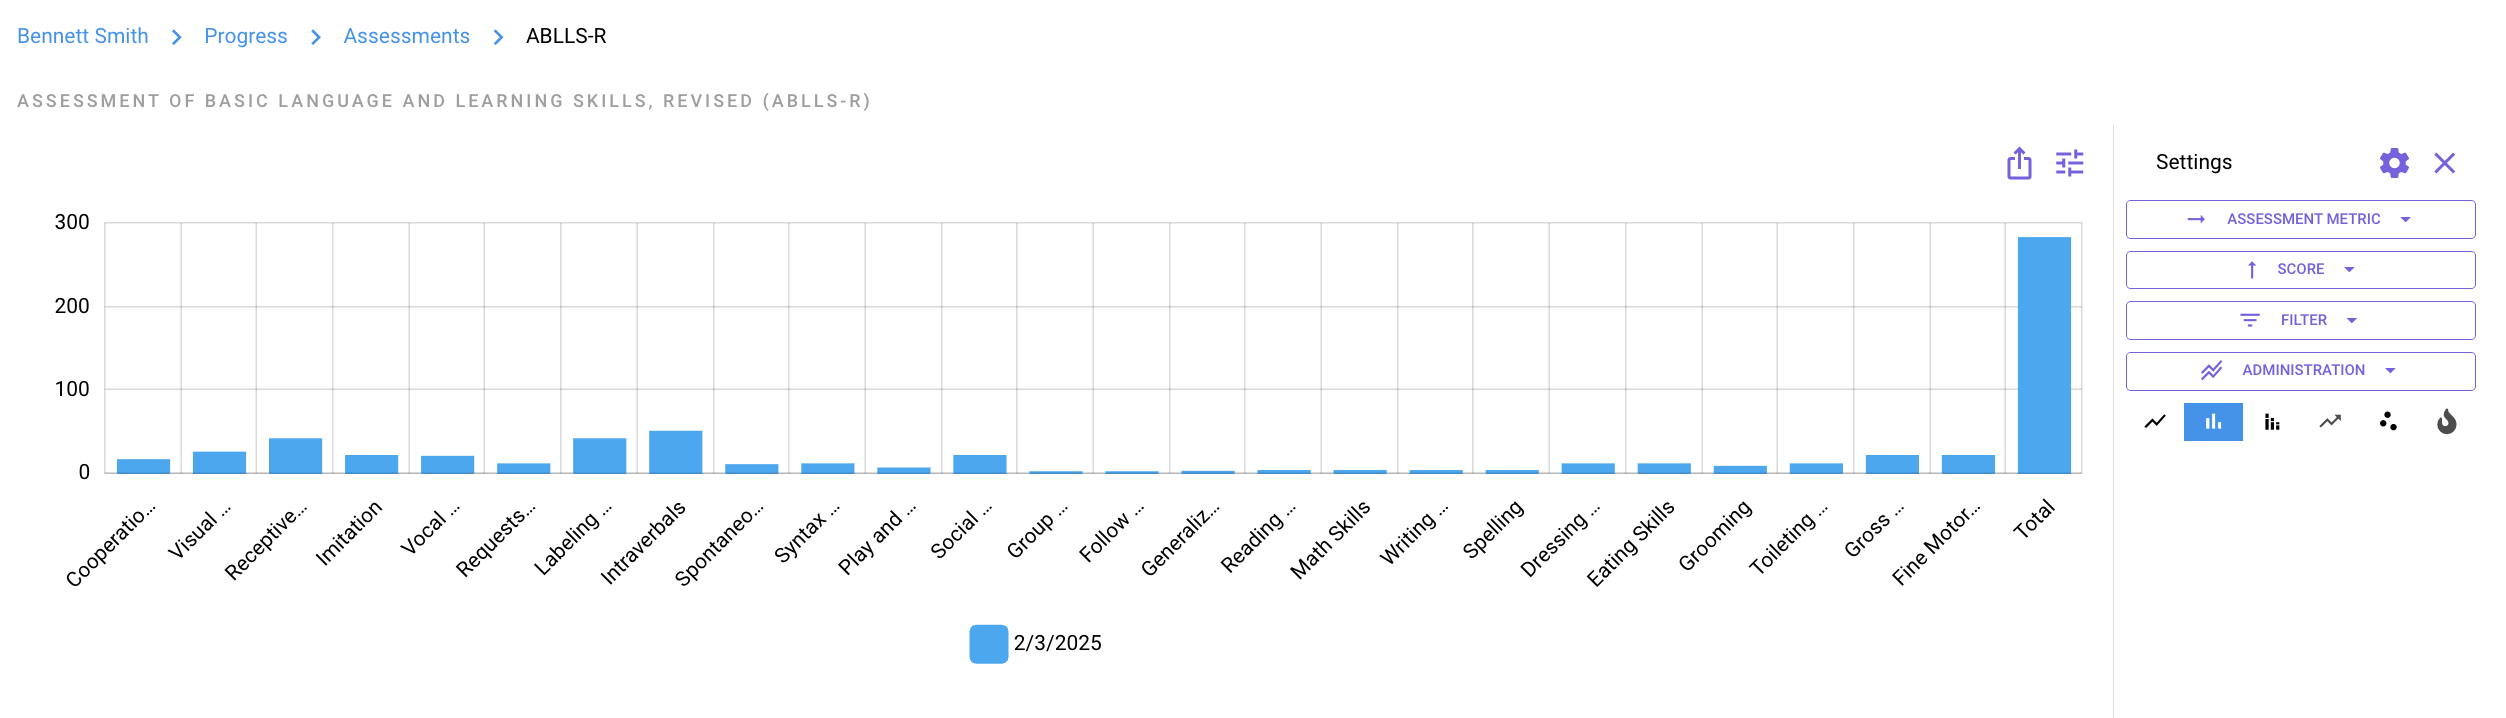
ABLLS-R
Caution: The ABLLS-R was not made to give one total score. But we know clinicians need a way to record their scores. So Hi Rasmus gives each item/skill a score out of 1 point. There are 544 items, so the highest total score is 544.
Each item/skill in a domain is split up by its number of boxes:
- 4 boxes: each box is worth 0.25. All 4 boxes = 1 point.
- 2 boxes: each box is worth 0.50. Both boxes = 1 point.
- 1 box: that box is worth 1 point.
So an item can score 0.25, 0.50, 0.75, or 1.
See How to Add Assessment Results above.
-
Select [ABLLS-R] from the drop down menu.
-
Add [ABLLS-R Section Scores]
-
The Total Score field is not auto-calculated. Users are responsible for manually adding the final score before saving.
AFLS (Basic Living Skills, Community Participation, Home Skills, Independent Living Skills, School Skills and Vocational Skills)
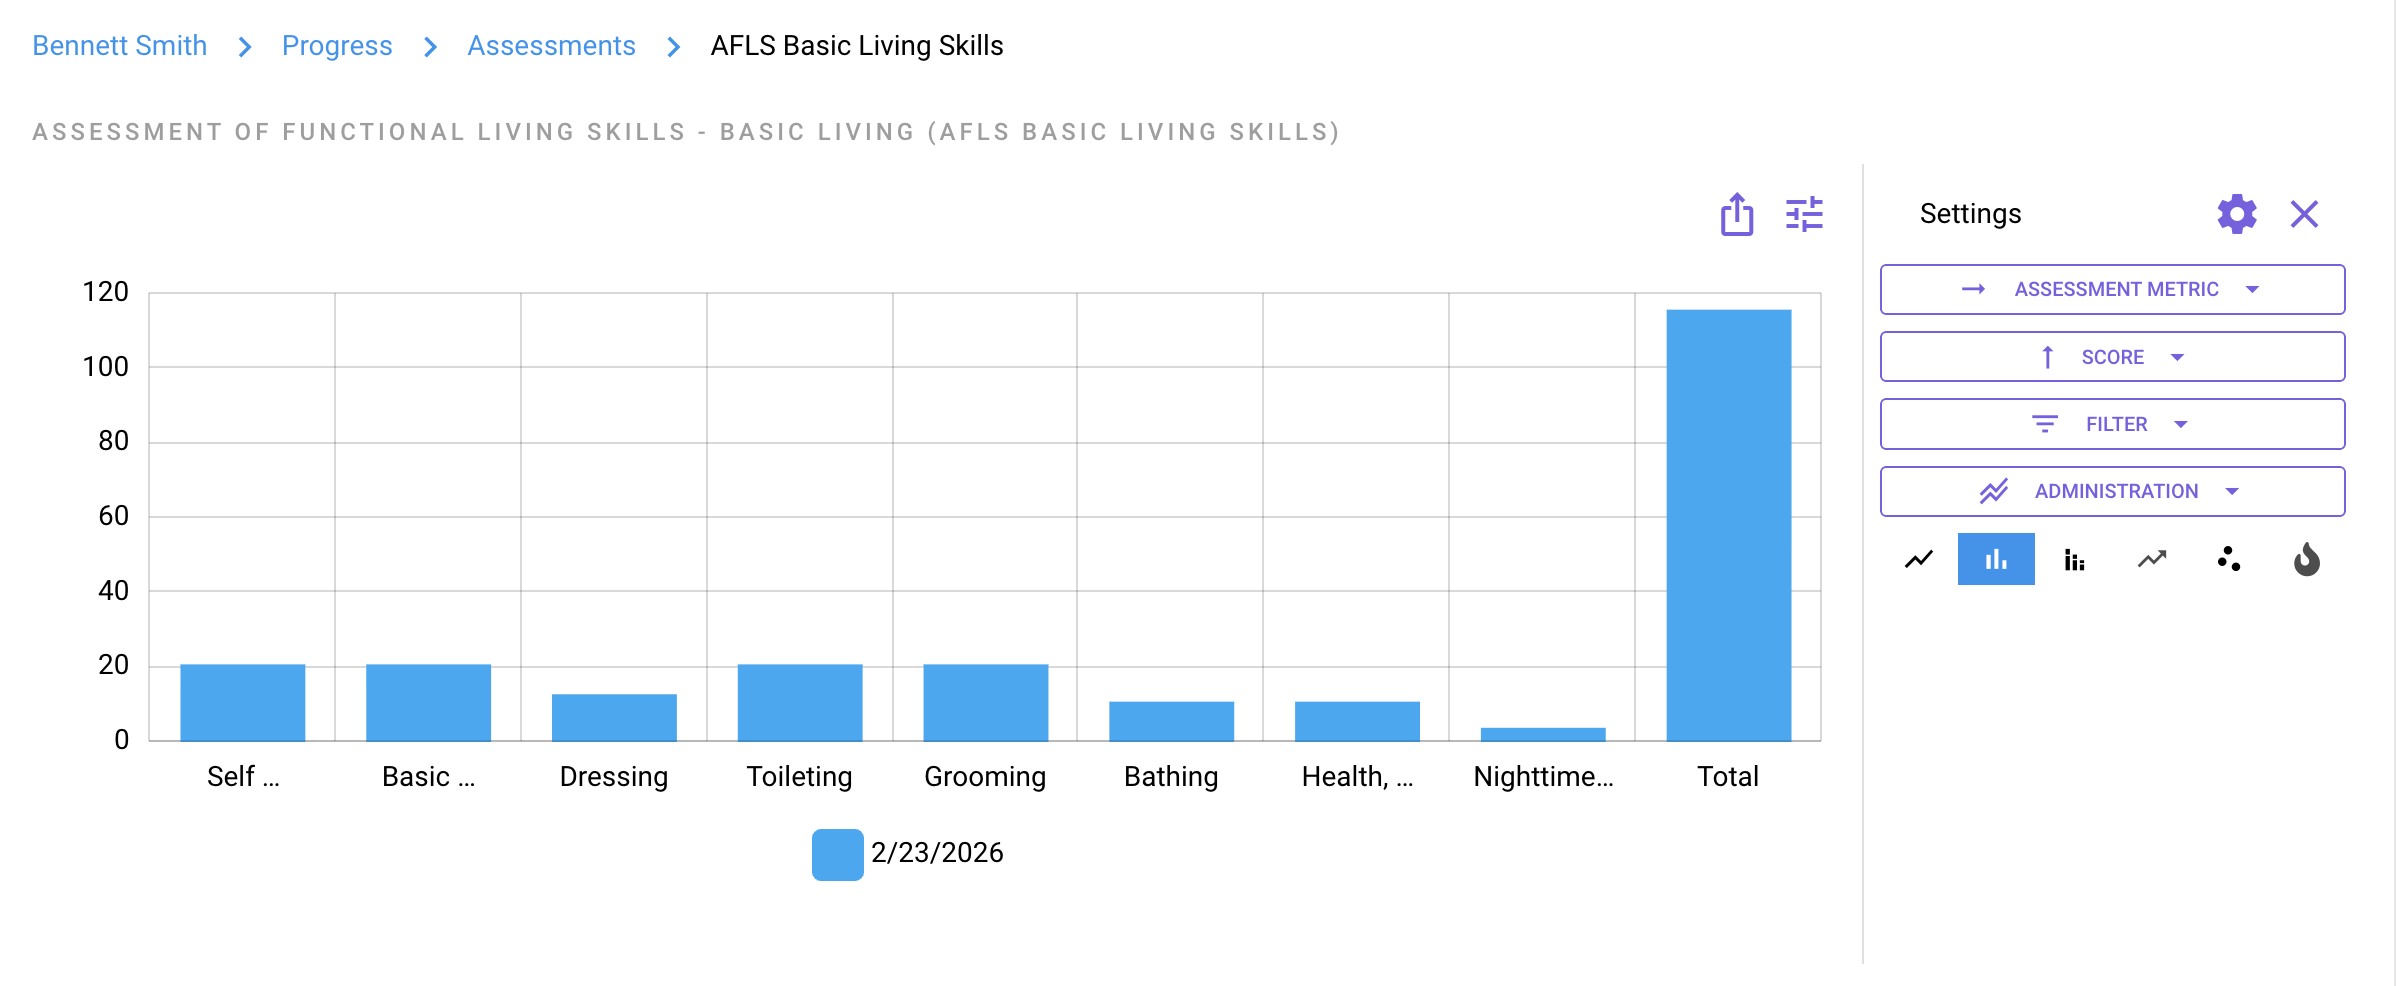
Disclaimer: The AFLS was not originally designed to be scored using overall “totals.” However, if your team prefers to display totals, this functionality is available as an option within the platform.
See How to Add Assessment Results above.
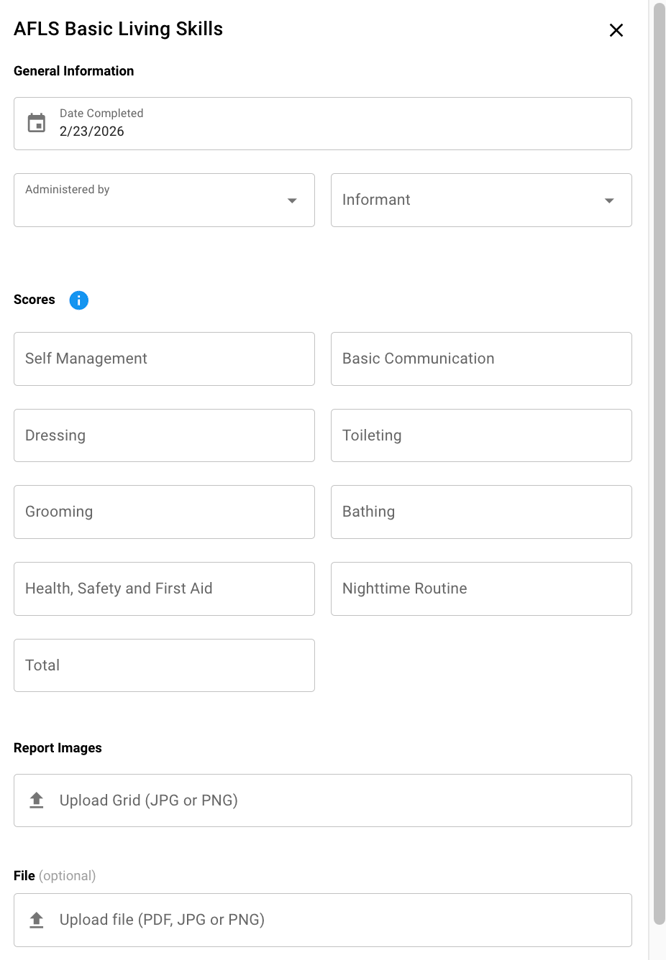
- Select one of the [AFLS] options from the drop down menu.
- [Informant] is the person who completed the assessment, typically a client, teacher, or caregiver.
- Add appropriate [AFLS Scores]
- The Total Score field is not auto-calculated. Users are responsible for manually adding the final score before saving.
Behavioral Health Index (BHI)
See How to Add Assessment Results above.
-
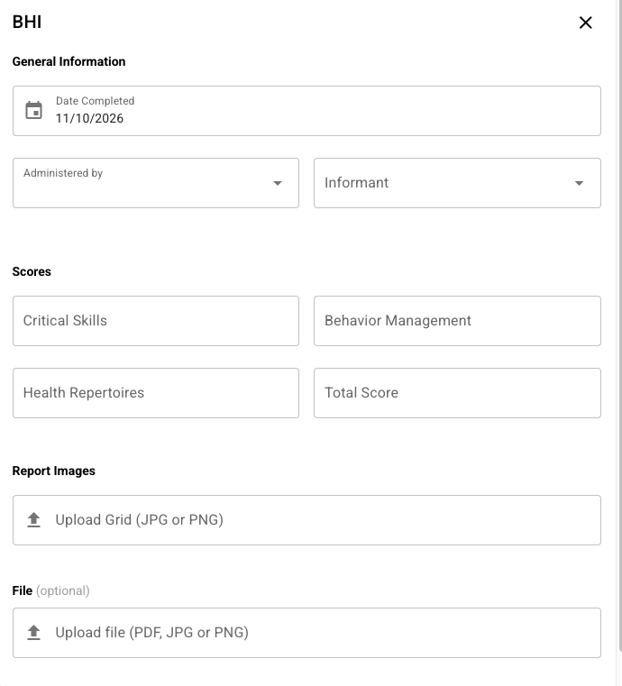
Select [BHI] from the drop down menu.
-
[Informant] is the person who completed the assessment, typically a client or their caregiver. This field is optional, and more than one informant can be selected.
-
Add [Scores]
-
There are 3 fields and a [Total Score] (out of 60) at the bottom. Scores are whole numbers.
📹 Child and Family Quality of Life, Second Edition (CFQL-2)
See How to Add Assessment Results above.
-
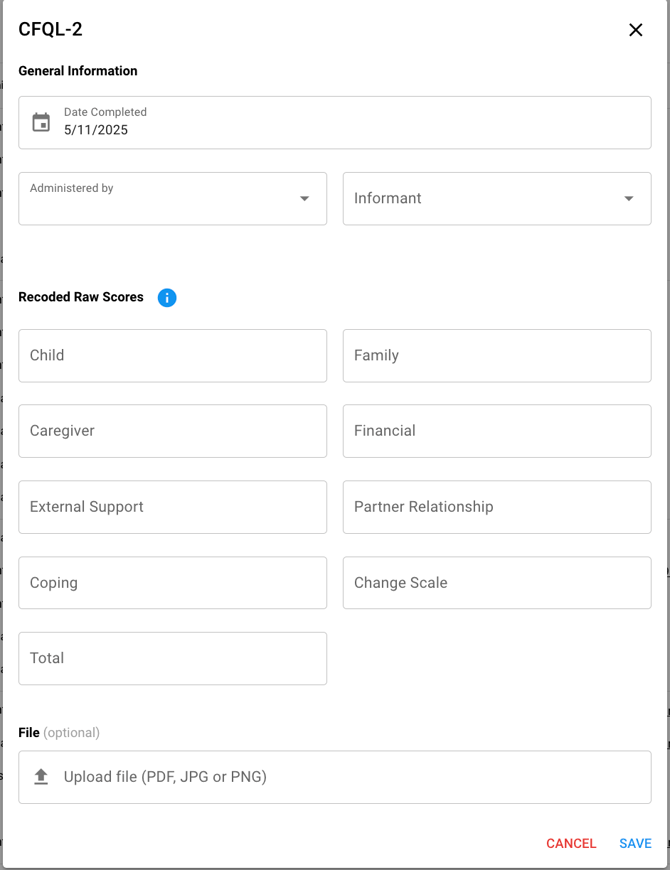
Select [CFQL-2] from the dropdown menu
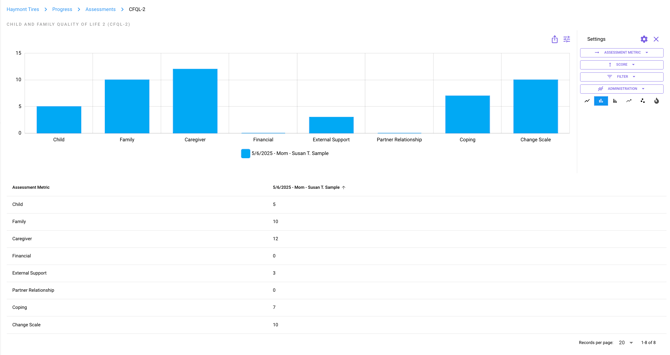
- [Informant] is the person who completed the assessment, typically a client or their caregiver. The Date and Informant information will be displayed on the graph.
- Add the [Recorded Raw Scores]
-
ℹ️ Note: These are not required fields, so if the parent does not complete a section (example: financial) the clinician is still able to generate a graph with the data points entered. The Raw Scores will be displayed on the graph
-
Add a File (optional)
📹 Functional Assessment Screening Tool (FAST)
See How to Add Assessment Results above.
-
Select [FAST] from the drop down menu.
-
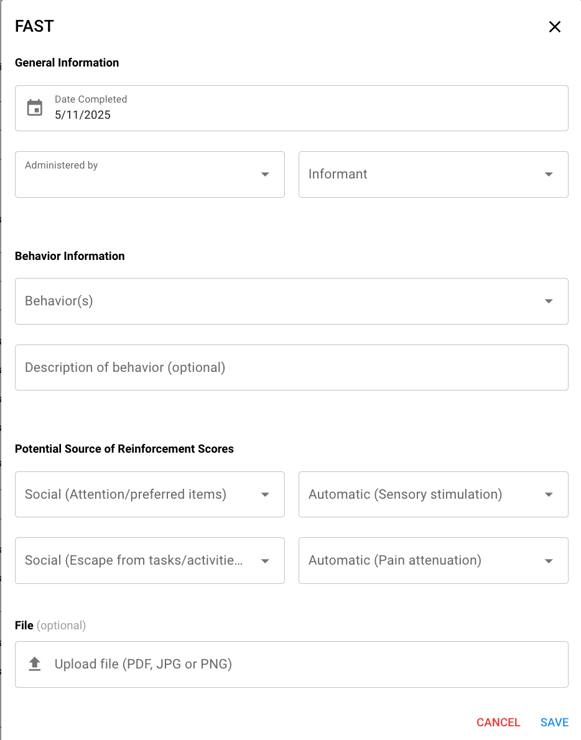
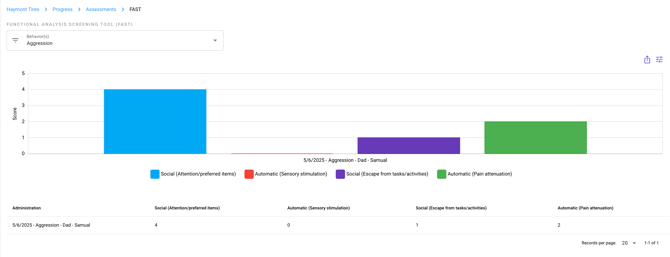
[Informant] is the person who completed the assessment, typically a client or their caregiver. The Date and Informant information will display on the graph.
-
Add [Behavioral Information]
-
Add [Potential Source of Reinforcement] Scores
📹The Inventory of Good Learner Repertoires (IGLR)
See How to Add Assessment Results above.
-
Select [IGLR] from the drop down menu.
-
Add [Percentile Scores]
-
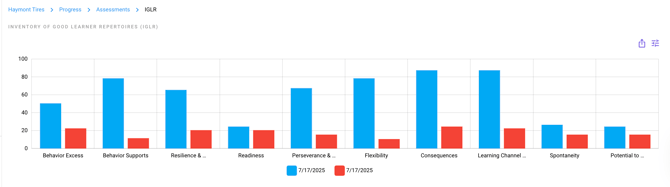
ℹ️ There are 10 fields, [Behavior Excess], [Behavior Supports], [Resilience & Regulation], [Readiness], [Perseverance & Focus], [Flexibility], [Consequences], [Learning Channel Preferences], [Spontaneity], [Potential to Benefit from Inclusion]. If the clinician only completed 7 of the 10 fields, leave the remaining fields blank.
-
These scores will display on the graph.

📹KIDSCREEN
See How to Add Assessment Results above.
-
Select [KIDSCREEN] from the drop down menu.
-
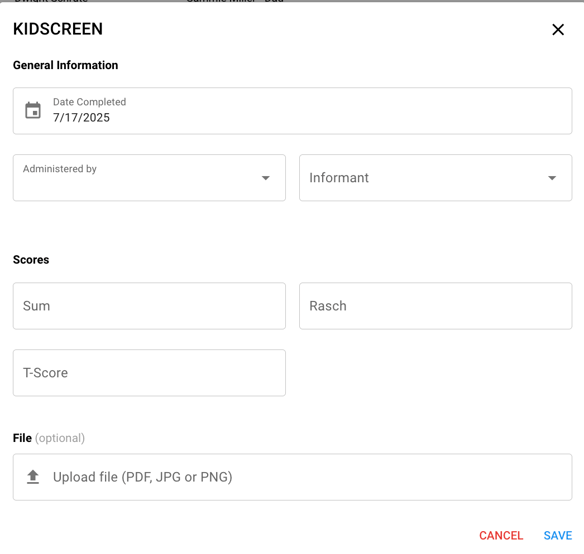
Add [Scores]
-
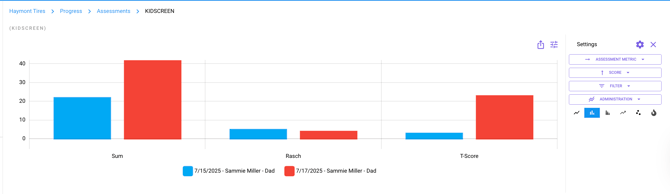
ℹ️ There are 3 fields, [Sum], [Rasch], [T-Scores]
-
These scores will display on the graph.
The Meaningful Outcomes Assessment Scale (MOTAS)
See How to Add Assessment Results above.
-
Select [MOTAS] from the drop down menu.
-
[Informant] is the person who completed the assessment, typically a client or their caregiver. This field is optional, and more than one informant can be selected.
-
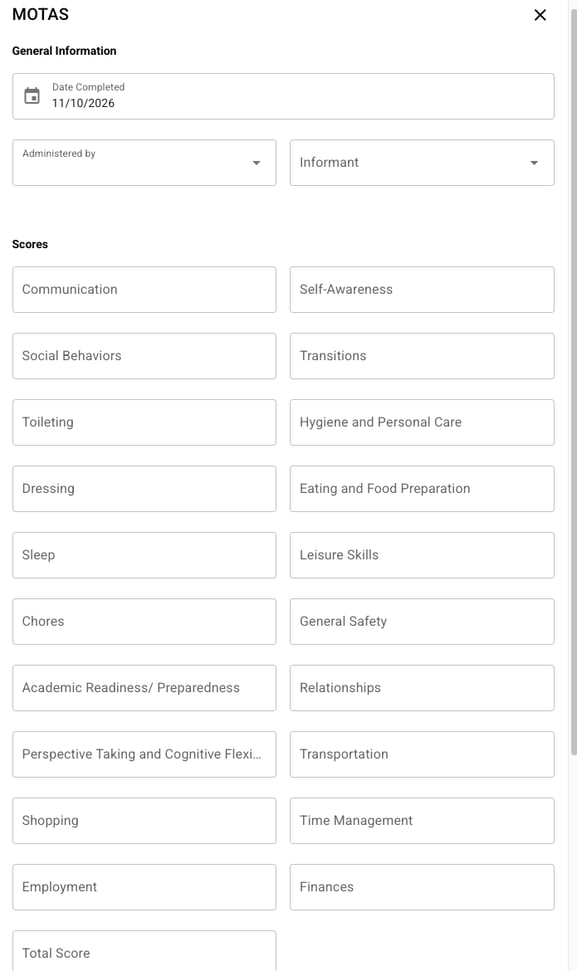
Add [Scores]. There are fields for each area. Scores are whole numbers.
- [Total Score] is calculated manually
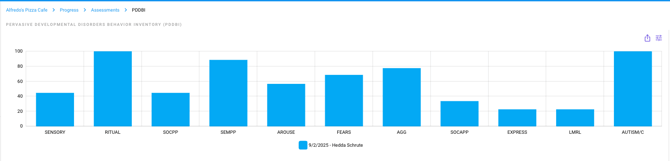
📹Pervasive Developmental Disorder Behavior Inventory (PDDBI)
See How to Add Assessment Results above.
-
Select [PDDBI] from the drop down menu.
-
The Date & Informant will display on the graph.
-
Add [T-Scores]

📹 Parent Stress Index (PSI)
See How to Add Assessment Results above.
-
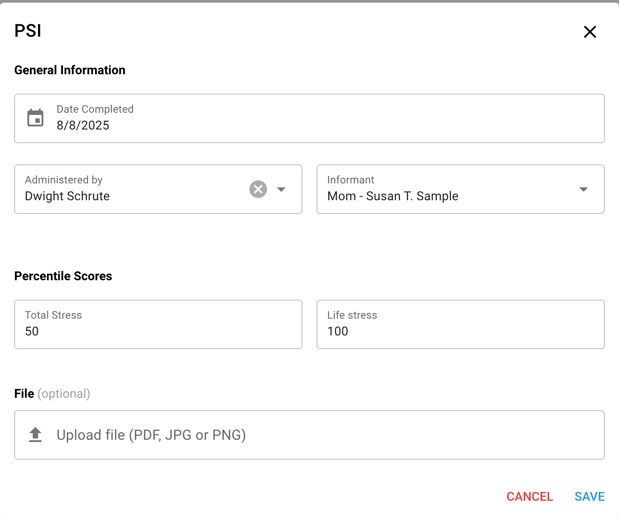
Select [PSI] from the drop down menu.
-
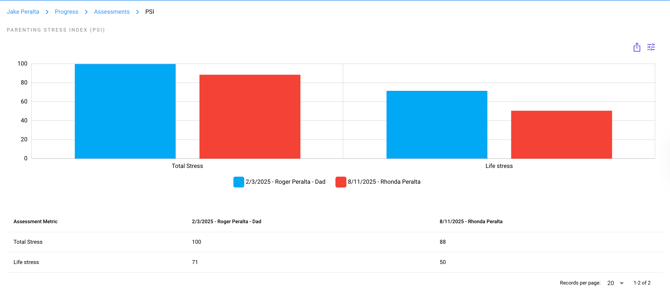
The Date & Informant will display on the graph.
-
Add [Percentile Scores]
Questions About Behavioral Function (QABF)
See How to Add Assessment Results above.
-
Select [QABF] from the drop down menu.
-
[Informant] is the person who completed the assessment, typically a client or their caregiver. This field is optional, and more than one informant can be selected.
-
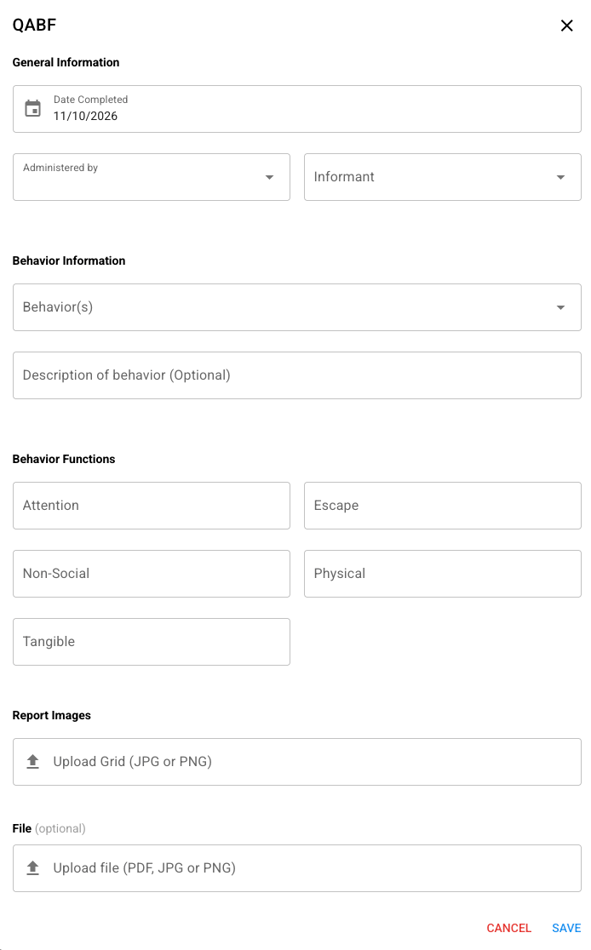
Add [Behavioral Information] (see step 7 above).
-
Add [Scores]
-
ℹ️ There are 5 fields, [Attention], [Escape], [Non-social], [Physical], [Tangible]. The QABF does not have a total score. Scores are whole numbers.
📹 Verbal Behavior Milestones Assessment and Placement Program (VB-MAPP)
See How to Add Assessment Results above.
-
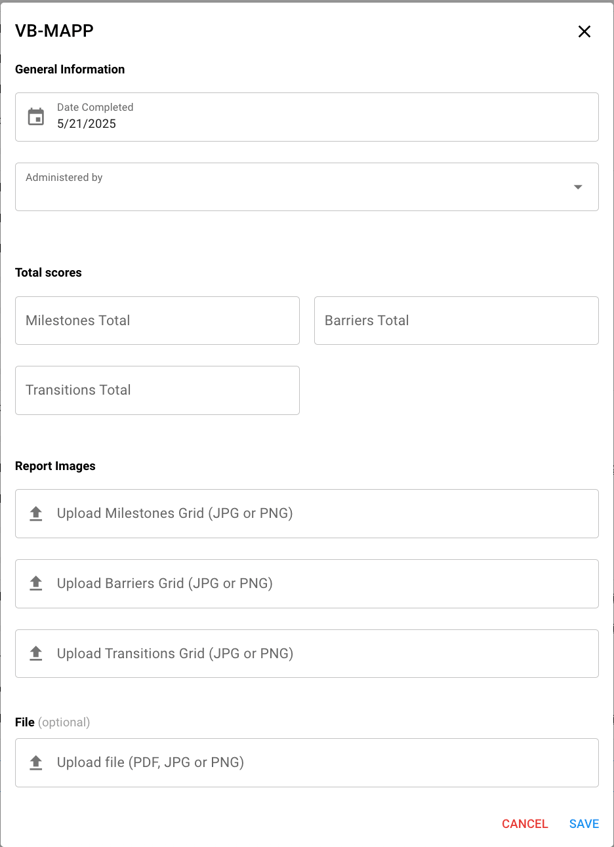
Select [VB-MAPP] from the drop down menu.
-
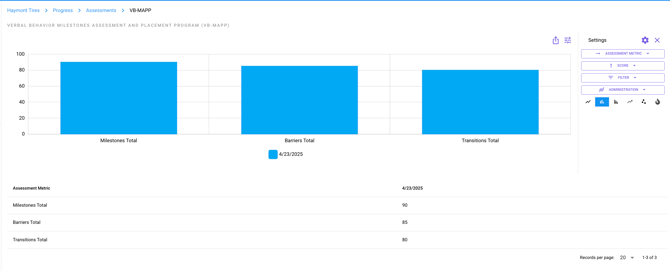
Add [Total Scores]
-
ℹ️ There are 3 fields, [Milestones], [Transitions], and [Barriers]. If the clinician only completed 1 of the 3 fields, leave the remaining fields blank.
-
These scores will display on the graph.
📹 Vineland-3
See How to Add Assessment Results above.
-
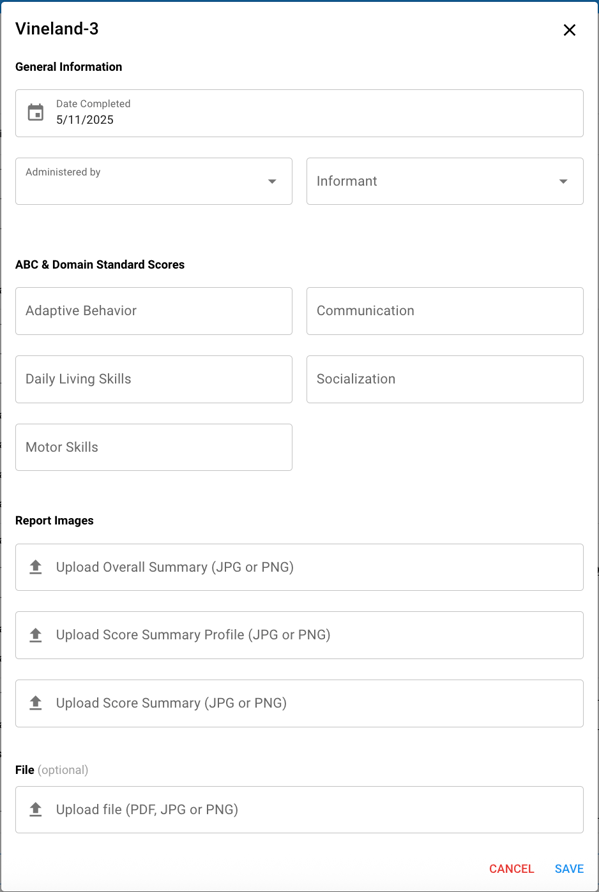
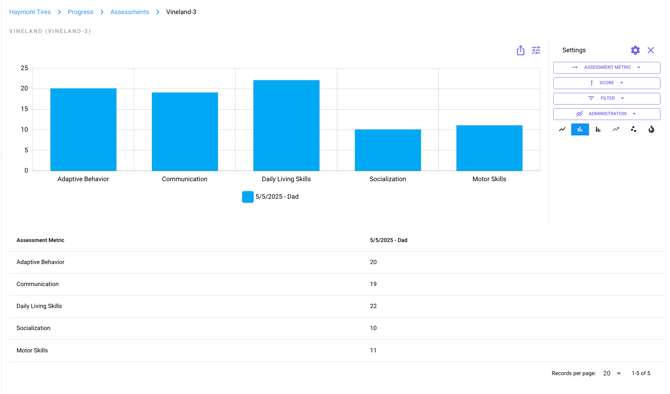
Select [Vineland-3] from the drop down menu.
-
[Informant] is the person who completed the assessment, typically a client, teacher, or caregiver.
-
Add [ABC & Domain Standard Scores]
ℹ️ Check out our KB Article on how to Add Assessment Results into Reports