For effective analysis of your data, trends, averages, and phase change lines are a practical way to visually indicate a change in condition or phase on a graph.

Trends & Averages
To add a trend and/or an average line to your graphs :
- Select a [client]
- Select [Progress] on the left side menu
- Select the [program name] to open the graph that you would like to edit
- Once on the selected graph, click on the [3 purple lines icon]
- Select [Annotations]
- Under [Analysis], toggle on [trend] and/or [Average]
Important Note
Trends are currently available only when graphing by session (along the x-axis).

Phase Change Lines
To add a phase change line to your graphs:
- Select a [client]
- Select [Progress] on the left side menu
- Select the [program name] to open the graph that you would like to edit
- Once on the selected graph, click on the [3 purple lines icon]
- Select [Annotations]
- Scroll down to [Phase Lines]
- Select [Add Phase Line]
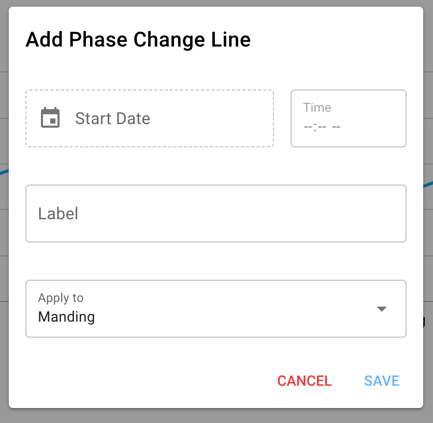
Indicate [Start Date], [Time]- this will default to 12:00AM, [Label], and select if you want to apply it to the all of your client's graphs by selecting their name, the program or target graph or custom (this graph only). Select [Save]. 
Important Note
To ensure that your annotations, whether it's a phase-change line(s), trend line(s), and/or average(s), are present every time you view the graph, select the [purple star] icon on the top right of the graph area. This will save this graph setting for the the next time you view the graph. This is the setting that will always display moving forward unless you re-save a new view. The saved graph view will also always be what is pulled into your report if you are including graphs.
How to edit an existing phase change line
- Once on the selected graph, click on the [3 purple lines icon]
- Select [Annotations]
- Scroll down to [Phase Lines.]
- Select the category where the phase change lives (client name, if on all graphs or program/target graph)
- Select the [black pencil] to the right of the phase change line you wish to update
- Change any of the information and press [save]

Updated September 2025