Creating Insights graphs is more effective than relying on a single program graph with adjustable settings because each saved graph captures a specific view of the data. This makes it easy to compare trends side-by-side, track different dimensions over time, and quickly return to the exact analysis you need without re-configuring filters every time. While a program graph can be adjusted to mimic an insight, Insights graphs let you build a library of consistent, reliable perspectives on your data that support deeper analysis and faster decision-making.
How to create a new insights graph
- Select [client] from dropdown list
- Select [progress]
- Scroll to the very bottom and select [new insights graph]
- Select your [DATA SOURCE]: This determines the source of the data being pulled onto the graph. (Each selection will adjust the options available on the x and y axis)
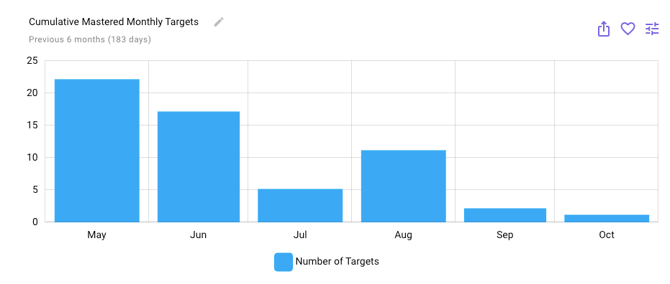
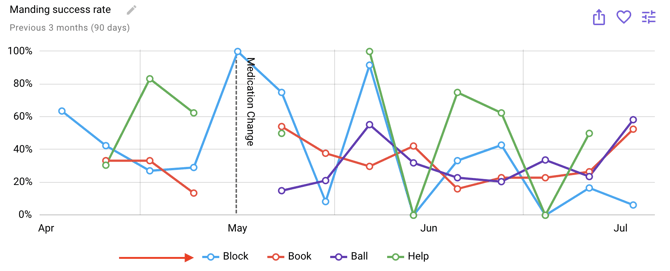
[Target] This uses the targets themselves as the data source instead of session data. This is most commonly used with cumulative and insights graphs. [Session Data] This is how you review progress for a client’s program. This will pull the data from the sessions that have been run.
[Trial by Trial] This pulls in the data specifically for each trial. It is most commonly used for SBT but can be useful to analyze data on a trial level
[Assessment Data] This will pull scores from assessments you have entered in for your client under progress > assessment
[Behavior Incident] This is used for ABC Data
- Select your [X-AXIS]:
Data Source X-axis Options [Target] Mastery Date (daily) - default
Mastery Date (weekly)
Mastery Date (monthly)
Introduction Date (daily)
Introduction Date (weekly)
Introduction Date (monthly)
Programs
Targets
[Session Data] Daily- default
Weekly
Monthly
Session
Program
Targets
Prompt Level
User
[Trial by Trial] Trial (by session) - default
Trial (cumulative)
Session
Programs
Targets
Prompt Level
User
[Assessment Data] Administration - default
Assessment Metric
[Behavior Incident] Daily - default
Weekly
Monthly
- Select your [Y-AXIS]:
Data Source Y-axis Options [Target] Cumulative - default
Number of targets
Days active
Sessions active
[Session Data] Percentage:
Percent Correct
Percentage of Total
Frequency:
Count
Rate:
Rate per Minute
Rate per Hour
Rate per Day
Learning Opportunities:
Learning Opps Count
Learning Opps per Minute
Learning Opps per Hour
Learning Opps per Day
Learning Opps per Session Hour
Duration:
Total Observed Duration
Min. Observed Duration
Max. Observed Duration
Avg. Observed Duration
Prompting Fading:
Prompt Success-Rate
[Trial by Trial] Percent Correct
Count
Learning Opps Count
Trial
Duration
Program:
Target
Prompt Level
[Assessment Data] Score
Min. Score
Max. Score
[Behavior Incident] Learning Opps Count
Duration:
Total Observed Duration
Min. Observed Duration
Max. Observed Duration
Avg. Observed Duration
- Select a [TIME PERIOD]: This adjusts the time frame viewed on the graph so be sure to select your preference
- Select [FILTER] settings: This allows you to narrow down or customize the information displayed on a graph. Filters help you apply conditions based on your data source, so the graph shows only the most relevant result
Data Source
Filter Options
[Target]
Programs
Tags
Program Type
Target Status
[Session Data]
Programs
Tags
Program Type
Target Status
Users
[Trial by Trial]
Programs
Tags
Program Type
Target Status
Users
[Assessment Data]
Assessments
[Behavior Incident]
Antecedent
Behavior
Consequence
- Select [GROUPING]: These settings allow you to group the data in different ways to see separate data paths.
Data Source
Grouping Options
[Target]
No grouping
Program
Target
[Session Data]
No grouping
Program
Target
Prompt Level
User
Hinted Prompt Level
Mode
[Trial by Trial]
No grouping
Program
Target
Prompt Level
User
Hinted Prompt Level
Mode
[Assessment Data]
No grouping
Administration
Assessment Metric
[Behavior Incident]
No grouping
Antecedent
Behavior
Consequence
- Select [CHART TYPE]: These settings change the chart type and how the data is visually displayed

Line Chart

Column Chart

Stacked Column Chart

Logarithmic Line Chart

Scatterplot

Heatmap
- Select [ANNOTATIONS]: These settings cover trend lines, average lines, and phase change lines
- Once your graph is set up to display the data you are looking for, select the [purple heart] in the upper right corner
-
- Give your insights graph a name
- Choose to save this insights graph to only this client or all clients in your organization
-
Quick Tip: Efficiently remove programs from your view by selecting the program and/or target name or icon from the key below the graph. The corresponding data will disappear from the graph, and the program will appear in gray in the key. Want to add it back? Simply click on the program name again!
Export your graph and / or data:
Need to add your graph to a report? No problem! We have made exporting data simple and straightforward.
Select the ![]() icon at the top right corner of your graph; here, you are offered options of exporting as an image (PNG, JPG, SVG, PDF), as data (JSON, CSV, XLSX, HTML, PDF), or a printed document.
icon at the top right corner of your graph; here, you are offered options of exporting as an image (PNG, JPG, SVG, PDF), as data (JSON, CSV, XLSX, HTML, PDF), or a printed document.
-Updated October 2025