
💡 Considerations for Rating Scale Prompt Level Templates:
- Rating Scale has been optimized for Skill Acquisition Programs with Discrete Trial target types. We do not recommend using rating scales with different program or target types.
- Mastery Workflows are not compatible with the Rating Scale prompt levels.
Watch: Create a Rating Scale Prompt Level Template
Step by Step: Creating a Rating Scale Prompt Level Template
To create a Rating Scale prompt level template, follow these steps.
1. Navigate to [Settings] and select [Programs], then [Prompt Levels]
2. Click [Add Prompt Level Template]
3. Give your Prompt Level Template a name and select the settings wheel to the right of the template name and select [Rating Scale]
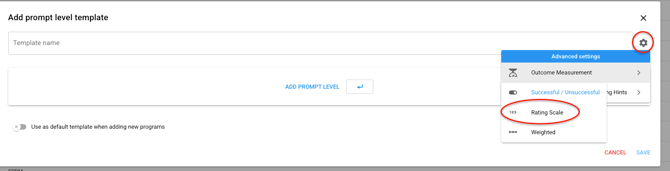
4. Click [Add Prompt Level] and begin building your rating scale. You will name your prompt levels and assign them a numerical value.
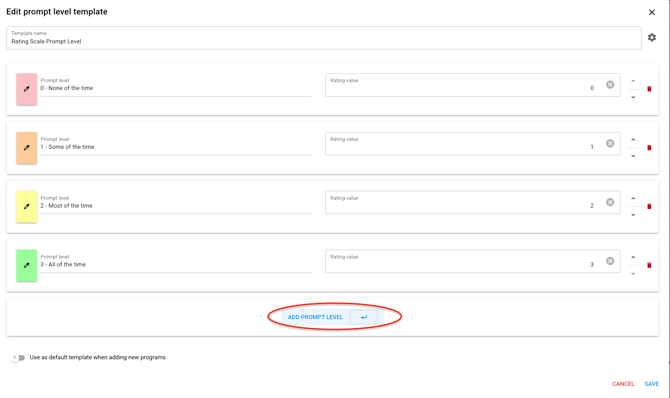
5. Once complete, select [Save]
6. You can now use this Rating Scale in the Data Recording tab when building a Skill Acquisition program.
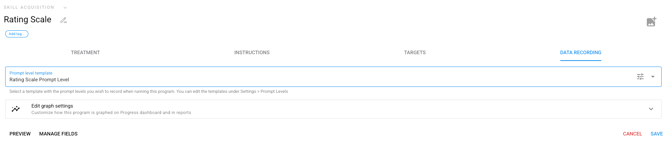
Rating Scale Graph Settings
Rating Scale prompt level templates can be viewed both on the program graph and on the target level graph.
To view Average Rating on the graph, follow these steps
1. Select [Data Source] and [Session Data]
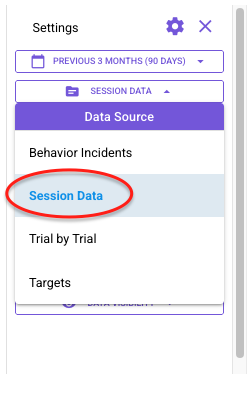
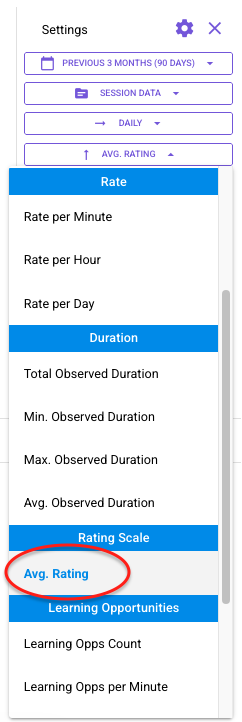
2. Select the Y Axis Settings and choose [Avg. Rating]
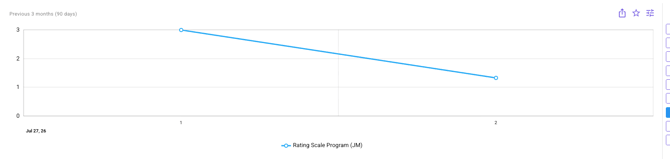
3. Your graph will now show the average rating along the Y-Axis. Each data point will be an average of the scores for that day, session, or week - depending on your X-Axis settings.
4. Click the Star icon to save this view as your default.
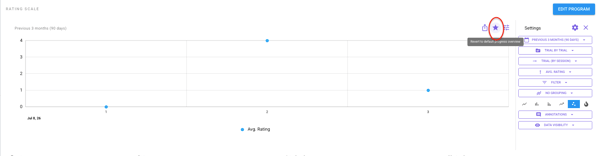
To view individual Rating scores on the graph, follow these steps:
1. Select [Data Source] and [Trial By Trial]
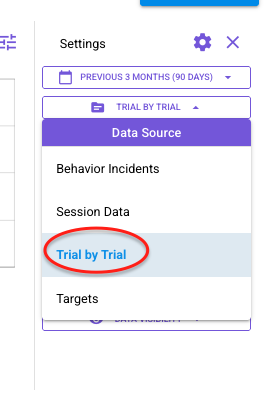
2. Select the Y-Axis Settings and choose [Rating].
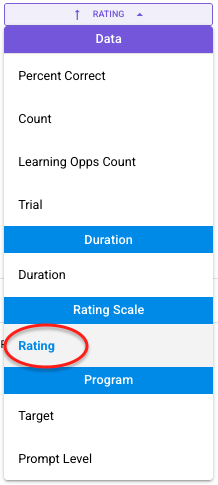
3. Your graph will now show the rating along the Y-Axis. Each data point will be an individual rating score, not an average. The X-Axis will display the trial number.
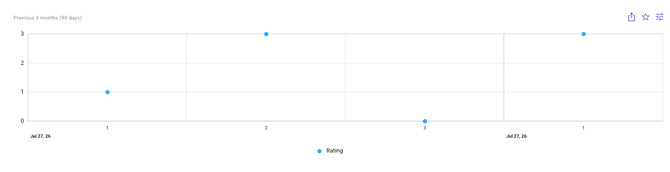
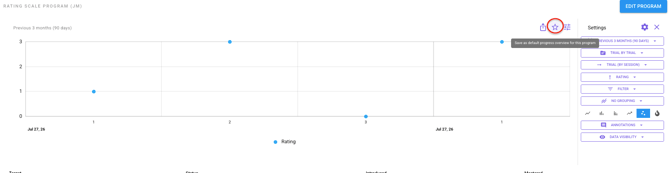
4. Click the Star icon to save this view as your default.
💡 Thing to note about Average Rating Graphs:
- The chart will only pull data from programs with a Rating Scale prompt level template. It will filter out data from other Prompt Level Templates.
- If any Y-axis option other than Avg. Rating or Rating is selected, all rating-scale data is strictly filtered out to prevent chart distortion. This will result in a notice that [No data for the current filters in the selected date range...] on the graph.
- The minimum and maximum values on the Y-Axis correlate with your minimum and maximum value in the Rating Scale prompt level template.